Overviews
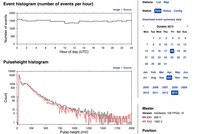
On the start page of the HiSPARC Public Database is an overview of all detector stations. Here the status of each station is indicated by colored status indicators. When choosing a station summaries of each day (from its first measurement up-to and including yesterday) will be shown in the form of graphs. A history of the configuration of the station can also be found here. As well as a page specifying the status of the station in more details, this can be useful to identify problems. The graphs also give insight in the quality of the data. Above each graph is a Source button that will provide a .csv (tab separated columns) file with the data points from graphs.
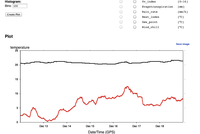
Data download
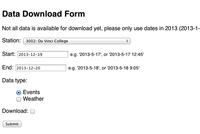
Through the page mentioned above you can also get to the data download form. Here a station, start and end date, and data type can be chosen. Then that data for this query can be downloaded as a .tsv file (a text file with tab separated columns) or viewed in a browser. The data is downloaded from the event summary database, this means that the data has already been partially analysed. The data contains information about the particle density in the detectors and the precise arrival times in each detector.
jSparc
jSparc is a JavaScript library which can use the data in the Public database. There are several web applications (Analysis software and Data retrieval) available that make use of this library and make it possible to analyse data in a browser. The source code of the jSparc library can be found on GitHub.
API
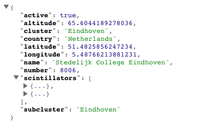
For programmers we also provide an API which makes it possible to easily retrieve metadata from the Public database. The API consists of a set of URLs that will always provide the latest up-to-date information. This way you can for instance check which stations measured data on a certain date or which stations are in a certain subcluster. It also provides access to the traces of the individual events. The API is usable by practically all programming languages. For Python and JavaScript it has been made easier, because functions have been added to the SAPPHiRE framework and the jSparc library to access the API. In the documentation the usage of the API is explained.
Maps
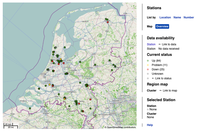
It is also possible to access maps through the public database that display the current locations of the HiSPARC stations. It is also possible to embed the map of a specific station into another website. This is used on the Organisation page, to always have an up-to-date map of the stations in each country, cluster and subcluster. For more information and the possibilities see the documentation.
SAPPHiRE
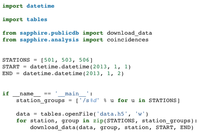
We have developed a Python framework called SAPPHiRE, provides functionality to analyse the HiSPARC data. It also contains a module to download data from the Public database. This Python package is available on PyPI, so it can be easily installed if one has Python and pip installed. By simply using the command 'pip install hisparc-sapphire', after which the package can be used in Python with 'import sapphire'. For more information see the documentation.
Documentation
For the packages that are mentioned here documentation is available via the Documentation overview.